Back in March of 2013, I did the first hillmaker related blog post. As way of background on hillmaker, here’s the opening of that post:
Many years ago I created an MS Access add-in called Hillmaker for doing time of day and day of week based occupancy analysis in health care delivery systems. A typical use would be to find the mean and 95th percentile of occupancy in a set of nursing units or an emergency department. Hillmaker was released as an open source project back in 2005 and has gotten quite a bit of use. However, I never really did any more development on it even though there were a number of enhancements that I (and many others) would like to have seen. The only attention it has gotten from me was in response to the object library problems caused by new releases of MS Office. No fun.
Since that time I’ve chipped away at a Python based version hillmaker. It’s finally in a state that I feel comfortable releasing. Still many improvements to make but core functionality is there.
So, here’s the content of the README file that comes with hillmaker.
hillmaker
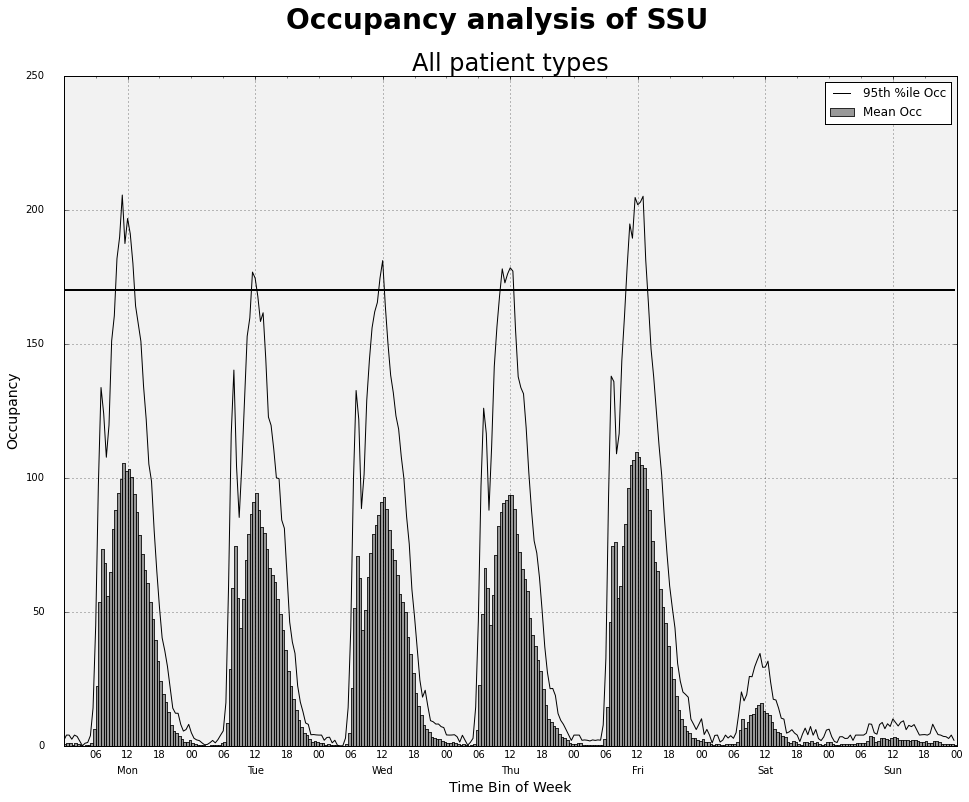
hillmaker is a Python package that computes time of day and day of week specific occupancy statistics from transaction data containing arrival and departure timestamps. Typical use is for capacity planning problems in places like hospital emergency departments, surgical recovery rooms or any system in which entities arrive, occupy capacity for some amount of time, and then depart. It gets its name from the hill-like nature of plots based on temporal occupancy statistics.
Occupancy Plot
A few features of the new hillmaker include
Takes a pandas DataFrame as the input data type
Functions for computing arrival, departure and occupancy summary statistics by time of day, day of week, and entity category based on a pandas DataFrame containing one record per visit.
Functions for computing arrival, departure and occupancy for each datetime bin in the analysis period, by category.
Select any time bin size (minutes) that divides evenly into a day.
Optionally specify one or more categories to ignore in the analysis.
Output statistics includes sample size, mean, min, max, standard deviation, coefficient of variation, standard error, skew, kurtosis, and a whole slew of percentiles (50, 55, 60, 65, 70, 75, 80, 85, 90, 95, 97.5, 99).
Output CSV files are written by default but can be supressed.
Optionally capture outputs as a dictionary of pandas DataFrames for further post-processing (e.g. plot creation).